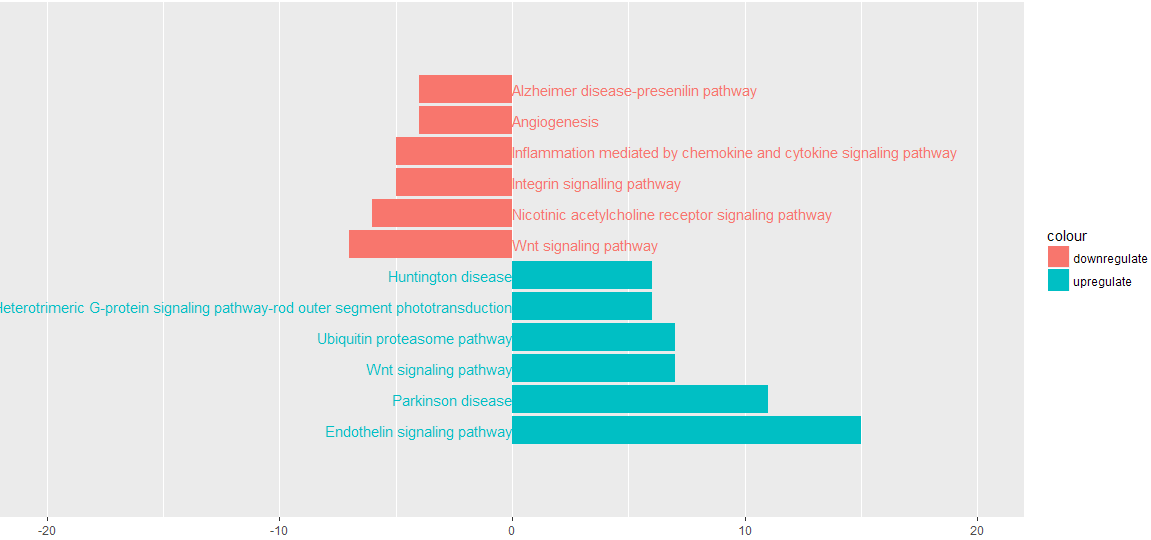
> data$colour <- ifelse(data$count < 0, "downregulate", "upregulate")
> data$hjust <- ifelse(data$count > 0, 1,0)
> ggplot(data, aes(pathway, count, label = pathway,hjust = hjust))
+ geom_text(aes(y = 0,colour = colour)) +geom_bar(stat = "identity",aes(fill = colour))
+ coord_flip() + labs(x = "", y = "") + scale_x_discrete(breaks = NULL, expand=c(0.2, 0)) + ylim(-20, 20)
|


