闲聊论文影响因子和分区
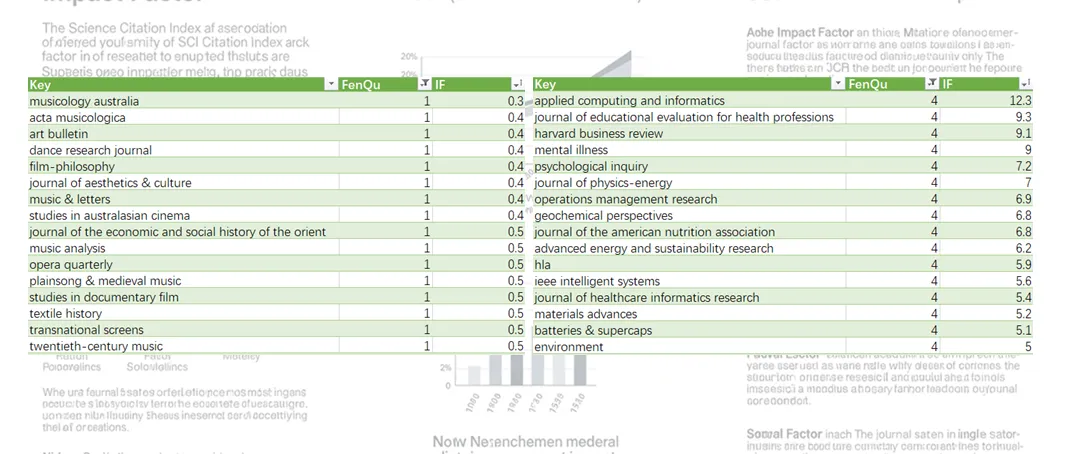
一个偶然的机会,发现大名鼎鼎的 NAR 居然才中科院二区,只有 6 分多的 fertility and sterility 却站上了一区。于是做了一些小小调查。正好赶上 Clarivate 发布了最新影响因子(IF),昨天各种公众号推文铺天盖地,这不得赶紧水上一篇蹭蹭热点。
一个偶然的机会,发现大名鼎鼎的 NAR 居然才中科院二区,只有 6 分多的 fertility and sterility 却站上了一区。于是做了一些小小调查。正好赶上 Clarivate 发布了最新影响因子(IF),昨天各种公众号推文铺天盖地,这不得赶紧水上一篇蹭蹭热点。

曾经沸沸扬扬的知乎屏蔽谷歌事件,以及谷歌收录速度减缓的传言似乎都指向传统搜索引擎的没落。但有一个方面传统搜索引擎几乎无可替代,那就是寻找特定的网页应用。
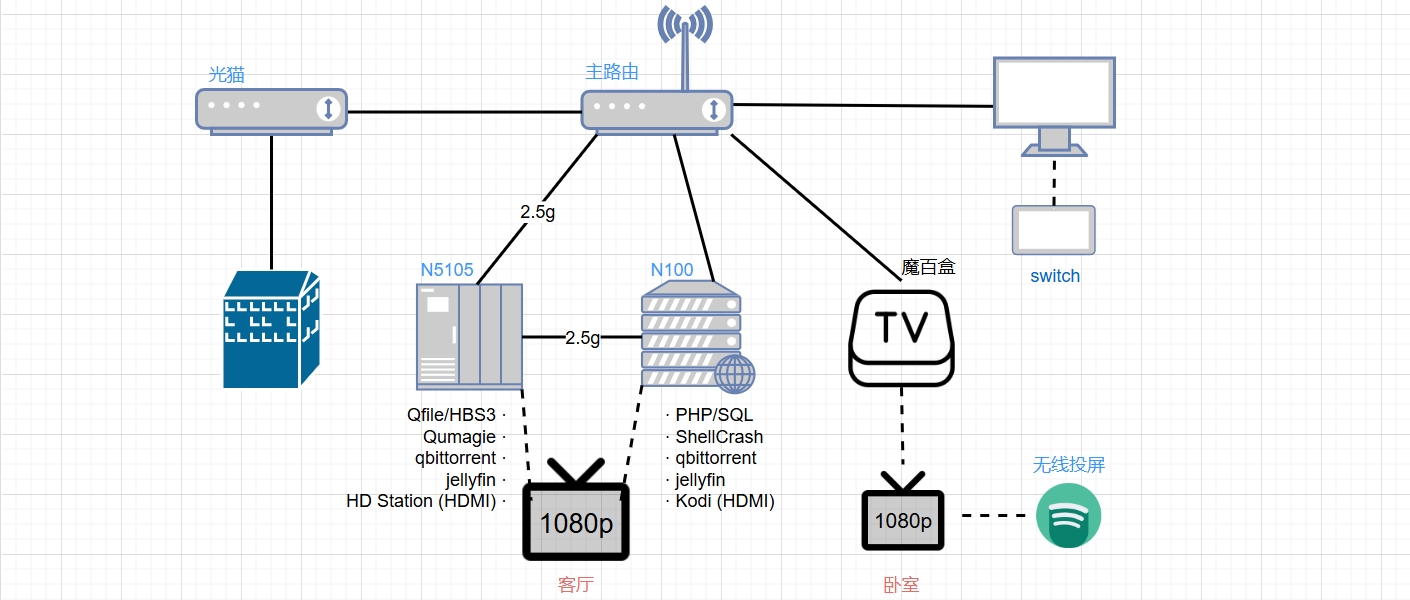
首图是目前的家庭网络设备拓扑图。虽然是教程贴,还是记录下前因后果。
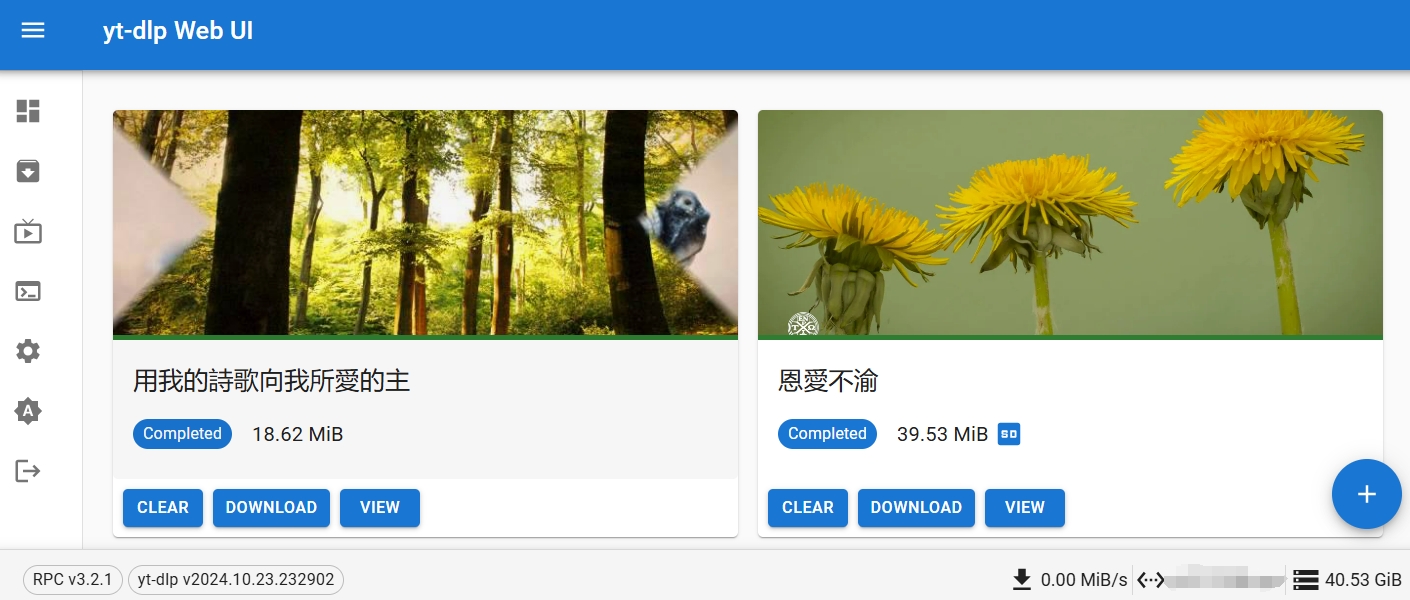
之前写过一篇配合 jellyfin 和 yt-dlp 下视频到威联通 NAS,用起来还是麻烦了点,这次总算找到个趁手的 yt-dlp web 管理工具,记录下来分享下。
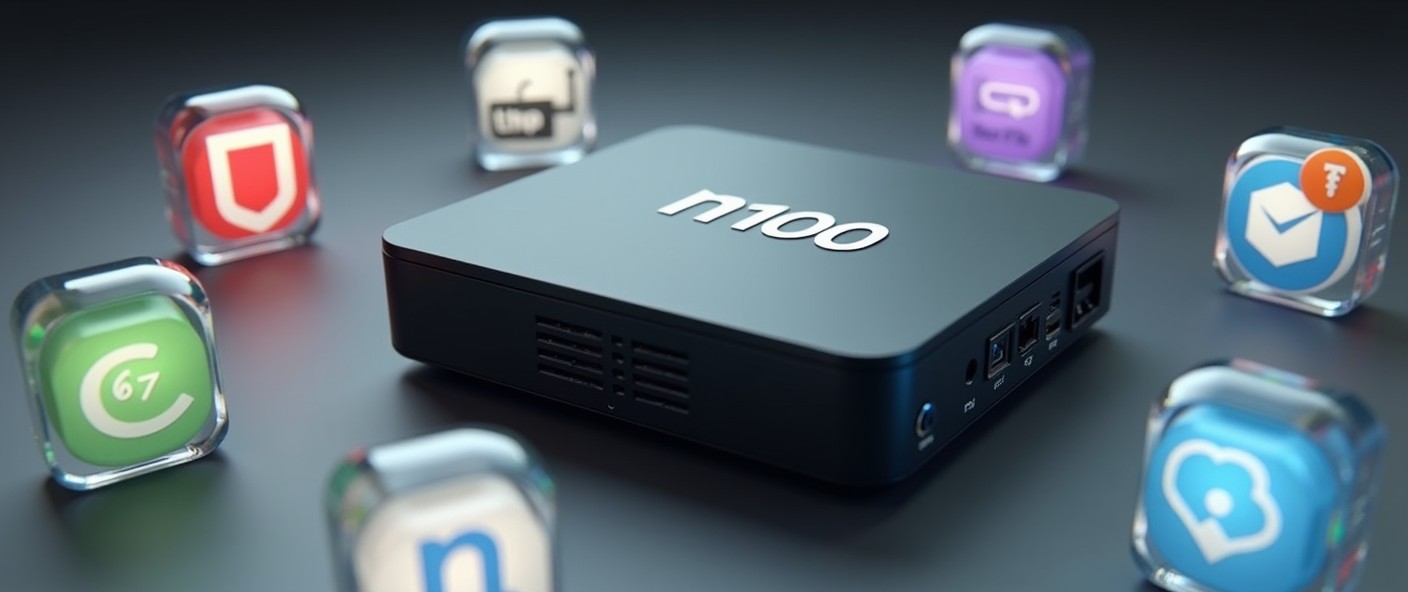
去年 6 月升级了 N5105 核心的 NAS, 目前为止几乎是 7x24h 在运行。PT、视频硬解、相册备份、甚至一些轻量计算任务统统不在话下,配合公网 ip 以及 20 多 T 的超大硬盘,拿捏几乎所有的 web 微服务。尽管用着很爽,时间长了缺点也渐渐显现: